Laboratory Flotation Test Procedure to Maximize Data Analysis
Introduction
Establishing and following a well-developed laboratory test procedure will provide good metallurgical performance data. Unfortunately there are important power, dimensional, static-dynamic, recirculating load, grind size-distribution, hydrodynamic, etc. differences between lab float cells and plant commercial units that limits direct correlation of lab metallurgy to plant results. At a basic level, laboratory test procedures should be able to simulate and provide metallurgical results that approximate expected mill results, at least on a chemistry level.
Lab studies are conducted for multiple reasons:
a) Can control selected conditions because mill process variability can quickly confound any investigation analysis
b) Able to test-evaluate one variable at a time while holding the other conditions constant to highlight impacts
c) Lab testing is much less expensive
d) Quickly testing a number of variables is possible
e) Lab investigations do not pose plant metallurgical risks
Plant system factors are difficult to simulate in the lab but good, direct chemistry and some physical variable information is possible. It is possible when using a proper lab test procedure and well designed test program to gain more information from flotation data and subsequent analyses that can better correlate and predict process response. This maximizes returns on the testing cost.
Grade-recovery (G-R) tradeoffs often confounds analysis of individual test conditions because individual tests rarely provide identical concentrate grades for direct recovery assessment and vice versa. Further, typically plant circuits are capacity limited meaning any condition that changes flotation rates directly impact recoveries. Lab tests are static and thus are limited in adequately predicting plant dynamic responses. Strictly looking at grade and recovery metallurgical data does not provide any flotation rate information. Using a ‘kinetics’ lab test procedure provides data for proper grade-recovery and flotation kinetics analysis, greatly increasing the amount of predictive information.
A lab test testing protocol and analysis procedures are outlined below that will maximize lab test data value. Using the procedure defined and explained below can provide results having greater predictive value. The goal of this paper is to provide a simple yet effective lab testing strategy and subsequent data analysis of the float test results that will increase understanding how conditions investigated are more likely to correlate with expected plant response.
Testing and Data Analysis Goals
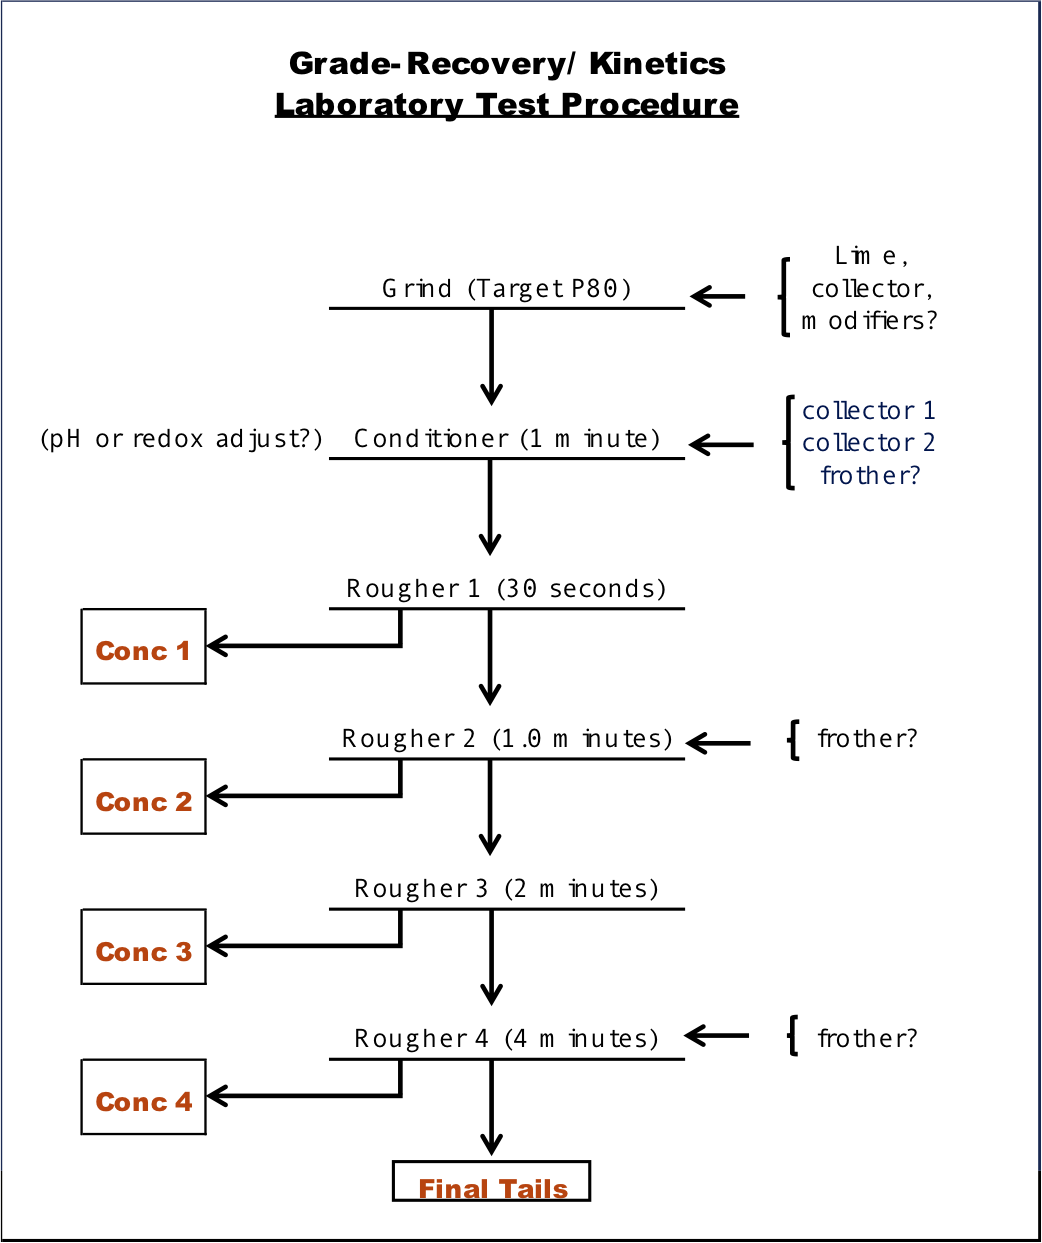
The procedure flowsheet provided in the Appendix provides the procedure recommended. The procedure outlined is valid and robust, easy to use, provides comparative metallurgy and also flotation kinetics data. The grind times, where chemicals are added and conditioned, etc. are mine and process specific and these must be used to adequately simulate the plant conditions.
In a single test, grade-recovery curve (G-R) metallurgical information and kinetics data can be calculated, plotted and analyzed. Timed froth samples are collected which are filtered, dried, weighed and assayed as normal. Cumulative concentrate grades and recoveries-distributions are obtained mathematically combining froth sequentially for each assay constituent. Two plots can be generated from this data:
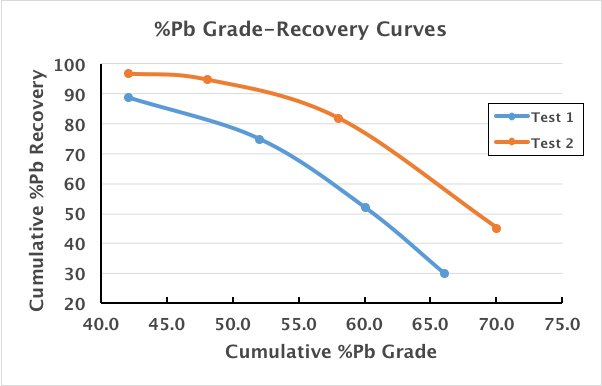
- Grade-Recovery (G-R): For each element of concern, plot the cumulative grade on the x-axis and cumulative recovery on the y-axis. This curve means that equivalent metallurgical results are obtained at any point on this curve. Note as shown in the example graph, the goal is to improve metallurgy, meaning the G-R curve is shifted to the right. As noted in the illustration below, at same concentrate grades or both conditions the rightward shifted test G-R curve shows effectively higher recovery was achieved if the test condition if the conditions of both tests could be controlled sufficiently to obtain equal concentrate grades.Further, if concentrate grade is of concern, the reverse analysis can be done by holding the recovery constant the difference in concentrate grades may be determined.
- Kinetics: For each element under investigation, plot the cumulative flotation time on the x-axis and cumulative recovery on the y-axis. This curve provides how fast the elements (associated minerals) are floated. Generally, higher kinetics is desired to maximize flotation recovery in the limited flotation circuit capacity.
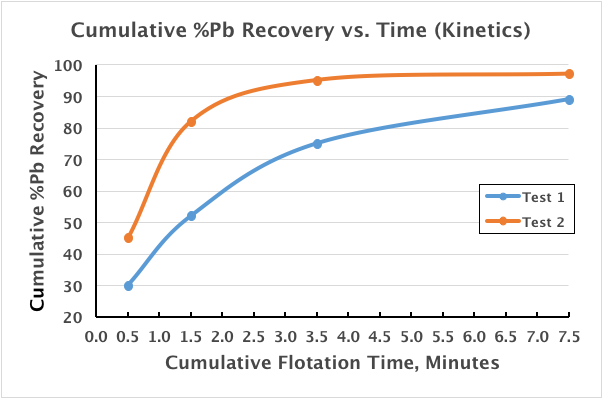
As shown in the graphs, each test condition (collector type, dosage, pH, etc.) may and should be plotted on the same graph for direct comparison. This analyzed data really highlights test condition differences and are used to more validly draw metallurgical and plant response predictive conclusions.
Appendix